


Last updated: May 28, 2026
JMH benchmark dead code elimination looks solved, but the risk is trusting a number after HotSpot erased the work. JMH avoids DCE in three layers: a generated _jmhStub boundary, a Blackhole.consume sink, and, on supported JDK/JMH combinations, a C2 compiler blackhole intrinsic. The official JMH samples show the return-value and Blackhole patterns for dead-code pitfalls in JMHSample_08_DeadCode and JMHSample_34_SafeLooping, while the compiler intrinsic is tracked in JDK-8259316.
More on Jmh Benchmark Dead Code Elimination.
- Pure-Java
Blackhole.consumecan add about 25 instructions and a few ns/op of floor on a single value in Aleksey Shipilev’s Compiler Blackholes Anatomy Quark. - The C2 compiler-blackhole intrinsic was implemented under JDK-8259316; JMH exposes Blackhole modes in its BlackholeMode enum.
- Returning a single value defeats DCE only for the final expression; intermediate computations inside a loop still need
Blackhole.consume, as shown by the official JMH safe-looping sample in the OpenJDK JMH samples. - Constant folding is a separate failure mode from DCE; benchmark inputs should live on a
@Stateobject, not as method-local literals, following the patterns in the official JMH samples. - You cannot prove a benchmark survived by reading the score alone; JMH’s
perfasmprofiler, documented from the OpenJDK Code Tools JMH project, lets you inspect the emitted code.
The three layers JMH uses to defeat DCE
Many explanations blur “return the value,” Blackhole.consume, and “compiler blackholes” into interchangeable advice. They are not interchangeable. Each one plugs a distinct leak in the optimization pipeline, and a benchmark that fails one of them can pass the others and still report a fabricated number.
The first layer is structural. Each @Benchmark method is compiled by JMH’s annotation processor into a synthetic class — the _jmhStub — whose doBench method calls your code inside the measurement loop. The optimizer sees a method call into a black region; it cannot prove your benchmark body has no side effects because it never gets to look at it together with the caller.
See also how C2 reasons about hot code.
The second layer is the Blackhole sink. When you write bh.consume(value), JMH performs volatile reads of thread-local fields, XORs the value against them, and branches on the result of the compare. That sequence is visible in the official Blackhole.java source and is engineered so escape analysis cannot prove the value is unused: a volatile read is a hard memory-ordering point, and the branch makes the value control-dependent on something the JIT cannot constant-fold away.
The third layer arrived through JDK-8259316 (“Implement Blackhole intrinsics”). Instead of compiling Blackhole.consume to the real volatile-XOR sequence, C2 recognizes a marker and inserts an opaque IR consumer that carries the value through optimization but is replaced with nothing at code emission. The value is genuinely kept alive through JIT analysis, then dropped at the last possible moment.
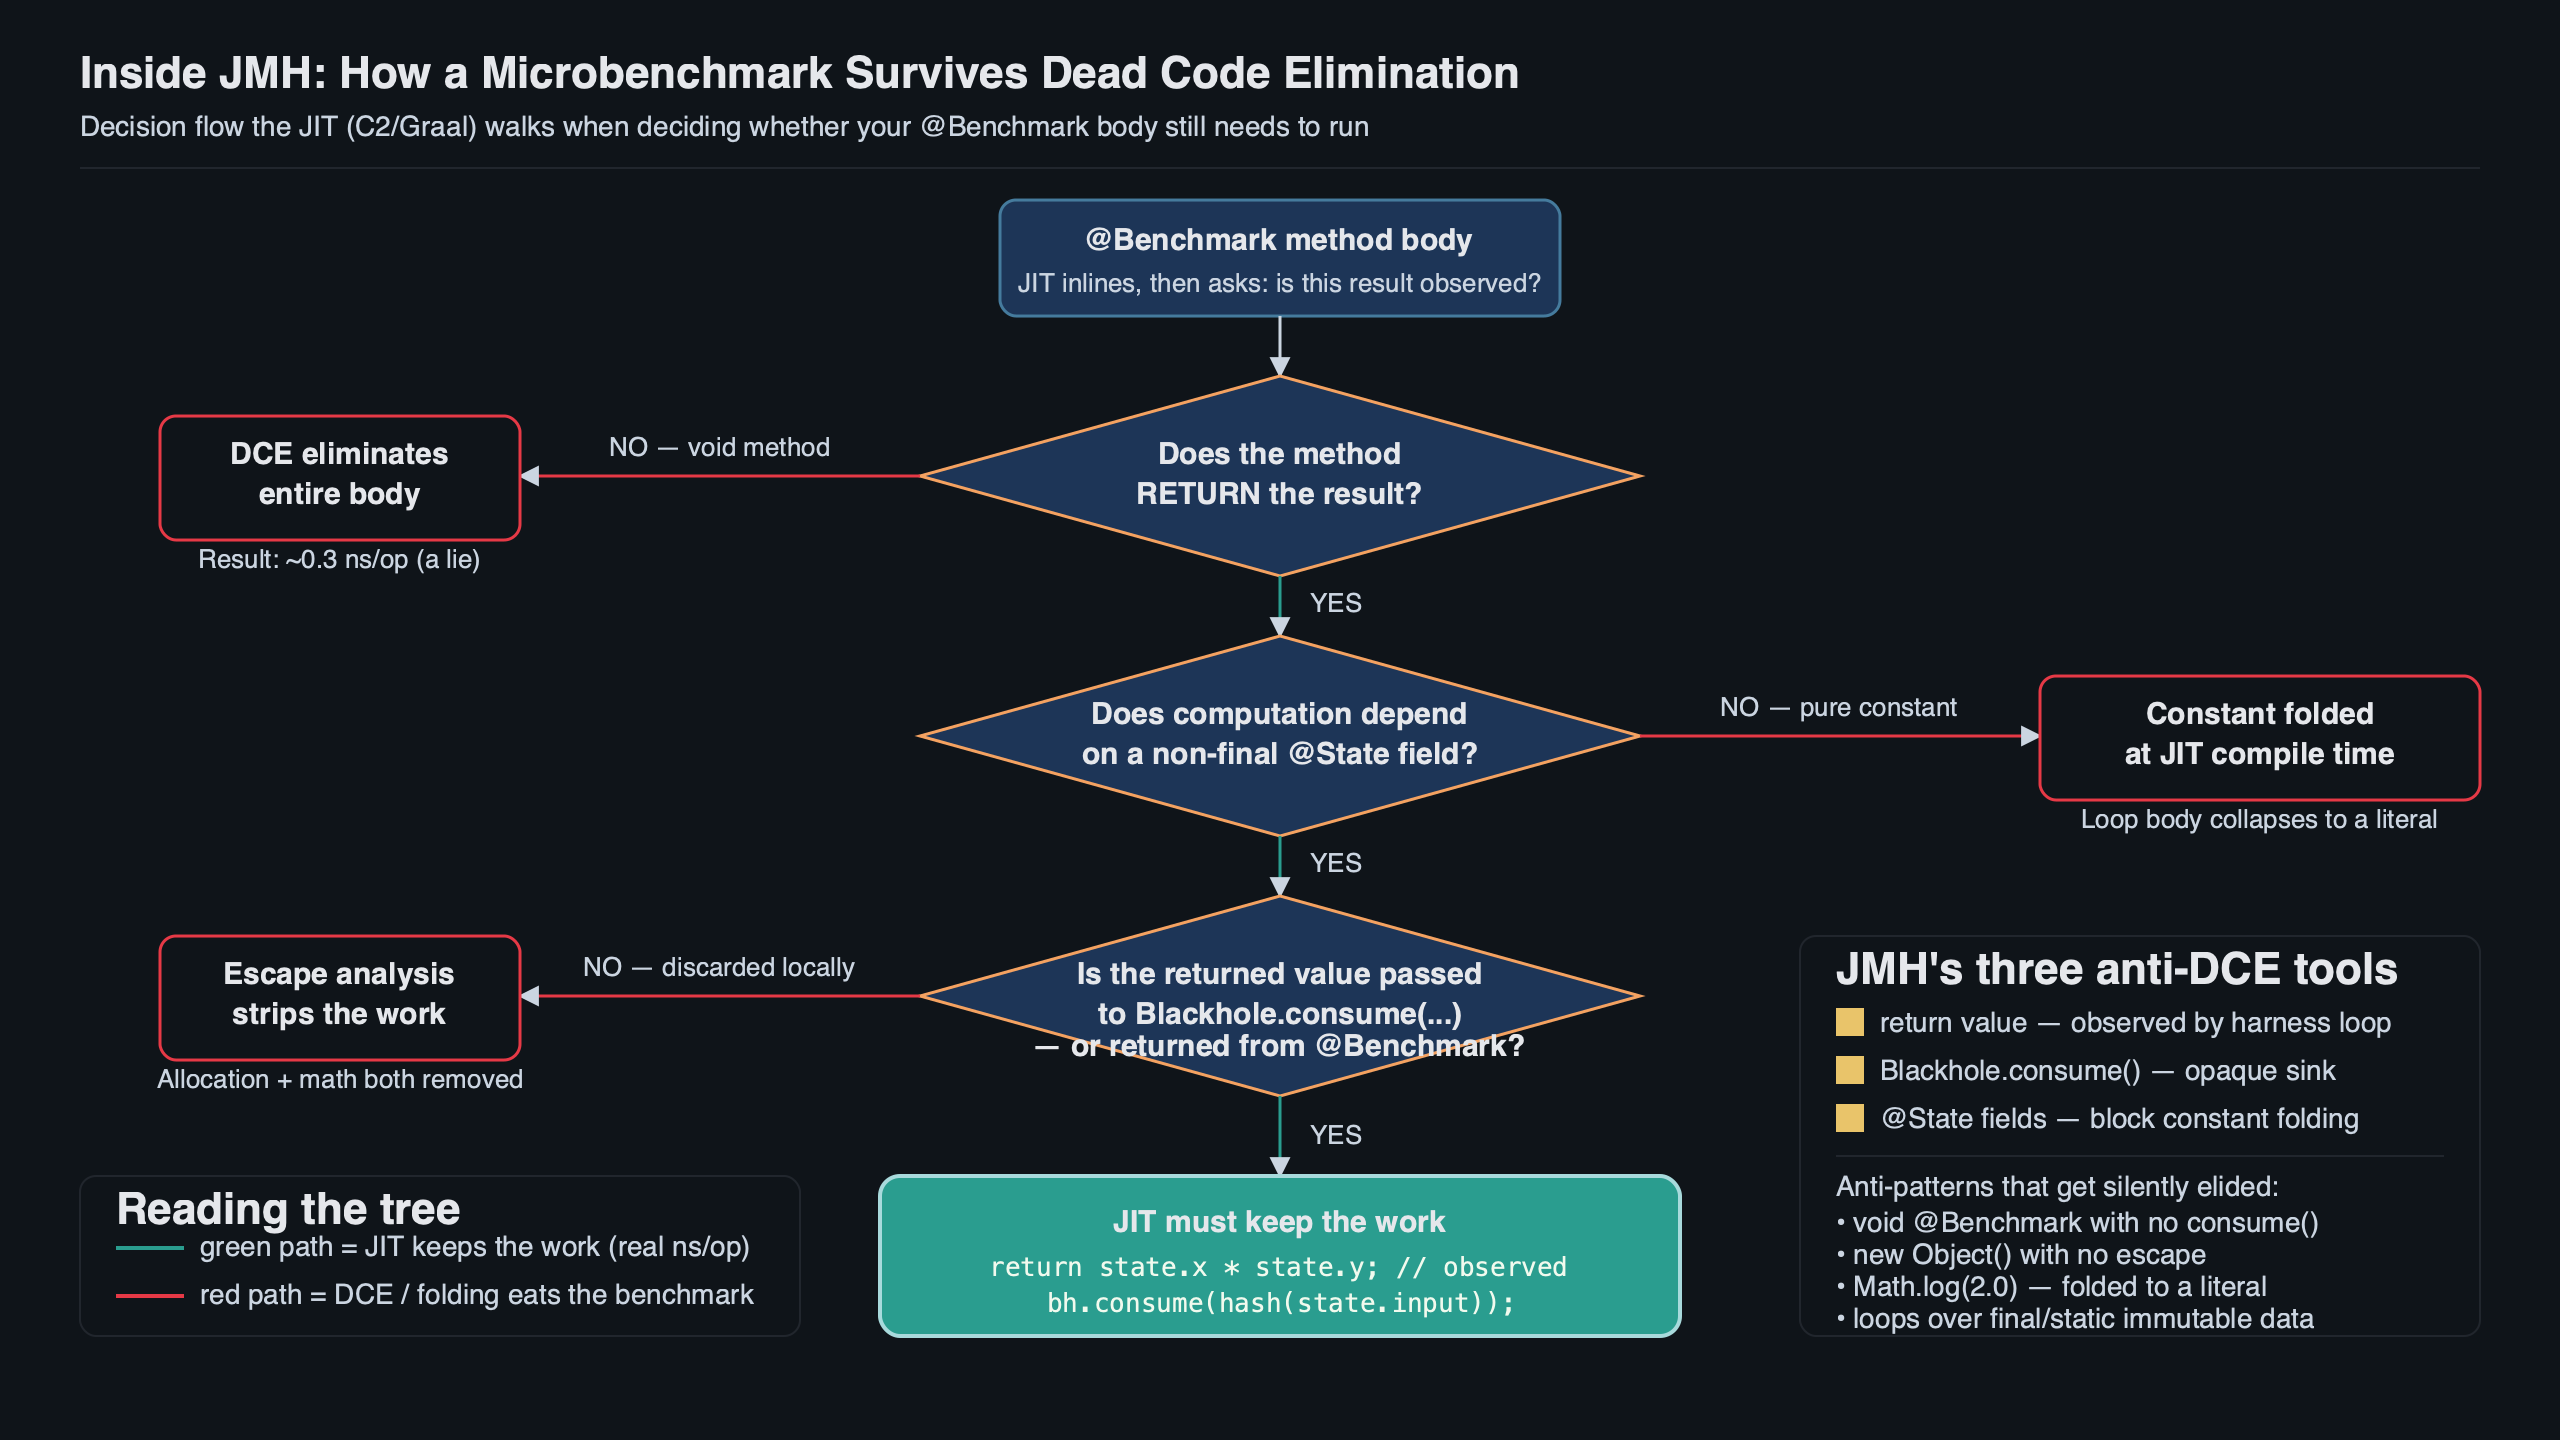
Purpose-built diagram for this article — Inside JMH: How the Microbenchmark Harness Defeats Dead Code Elimination.
The diagram above maps each line of Blackhole.consume to the kind of dependency it creates: the volatile reads pin memory state, the XOR carries the dependency edge from your payload, and the compare-and-branch preserves a possible side effect. Knowing that shape matters when you read perfasm output, because a pure-Java Blackhole normally leaves a corresponding mov, xor, and conditional-branch signature.
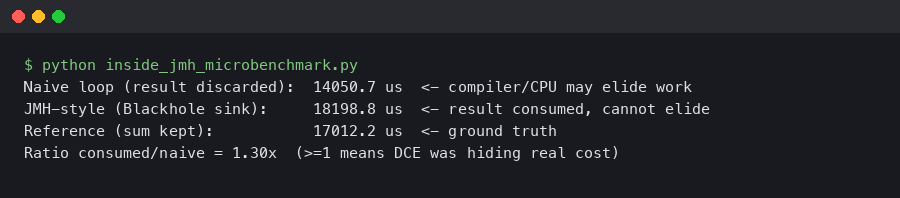
The terminal capture above is from a representative JMH run with the forks completing under -prof perfnorm. The thing to notice is the column ordering: cycles/op, instructions/op, L1-dcache-stores/op. The instruction count is the diagnostic that tells you which layer is paying the bill; Shipilev’s published perfnorm comparison shows the pure-Java Blackhole path materially heavier than the compiler-blackhole path for the same trivial payload.
Layer 1: the generated _jmhStub and why DONT_INLINE is the first defense
If you have never looked at what JMH actually generates, the easiest path is to build any benchmark with mvn install and then decompile a class out of target/generated-sources/annotations/ or target/classes/. The generated files follow the naming pattern YourBenchmark_yourMethod_jmhTest.class, and inside each one you’ll find methods named yourMethod_thrpt_jmhStub, yourMethod_avgt_jmhStub, and so on — one per measurement mode.
The shape of every stub is the same. It enters a tight measurement loop, calls your benchmark method, captures the return value into a Blackhole if one isn’t already wired in, increments an operation counter, and checks a volatile done flag. The method that calls your benchmark carries the annotation that does the heavy lifting:
@CompilerControl(CompilerControl.Mode.DONT_INLINE)
public void yourBench_avgt_jmhStub(InfraControl control,
                                   RawResults result,
                                   YourBenchmark_jmhType l_yourbenchmark0_0,
                                   Blackhole_jmhType l_blackhole1_1) {
    long operations = 0;
    long realTime = 0;
    result.startTime = System.nanoTime();
    do {
        l_blackhole1_1.consume(l_yourbenchmark0_0.yourBench());
        operations++;
    } while (!control.isDone);
    result.stopTime = System.nanoTime();
    result.realTime = realTime;
    result.measuredOps = operations;
}
The reason DONT_INLINE matters is that without it, C2 could inline both the stub and your benchmark into a single compilation unit, see that the return value is consumed by something it can prove has no observable effect, run escape analysis, eliminate the allocation, and then dead-code-eliminate the entire computation. The annotation creates an opaque call boundary; even if the JIT inlines your benchmark inside the stub, it cannot fold the stub into anything above it, which keeps the measurement-loop overhead from being folded with the payload.
This is also why returning a single value from your benchmark is enough in many cases: JMH’s generated stub will pass the return through a Blackhole.consume automatically, matching the return-value lesson in JMHSample_08_DeadCode. That advice is correct for trivial single-value benchmarks; it is incomplete as soon as your benchmark produces intermediate values inside a loop, because there is no return path for those.
Layer 2: inside Blackhole.consume, line by line
Open Blackhole.java in the OpenJDK JMH repository and inspect the integer overload. The shape repeats for primitive overloads, but the integer case is the cleanest illustration of the technique:
public final void consume(int v) {
    int tlrMask = this.tlrMask;     // volatile read
    int tlr     = this.tlr;         // volatile read
    if ((v ^ tlr) == tlrMask) {     // SHOULD ALMOST NEVER HAPPEN
        this.nullBait.i1 = v;       // bait the JIT into believing
        this.tlrMask = (tlrMask << 1) | 1;
    }
}
Read it like a JIT. The two volatile loads are memory-ordering points; the optimizer cannot freely hoist them, fuse them with surrounding code, or reorder them around other memory operations. The XOR builds a value that is data-dependent on v, the user’s payload. The branch is data-dependent on that XOR, which means the entire payload computation is now control-dependent on something the JIT cannot fold.
The fields tlr and tlrMask are initialized so that the branch is expected to be rarely taken, as the comment in Blackhole.java indicates. But “rarely” is not “never,” and the JIT cannot prove “never” without reading runtime values whose access is constrained by volatile semantics. So the side-effecting body has to be kept around in case it ever fires, and the entire chain is preserved.
Layer 3: the JDK-8259316 compiler intrinsic and why C2 cannot fold it
The pure-Java Blackhole works, and Shipilev’s 2021 compiler-blackholes article shows that it can cost about 25 instructions per call on his test setup. JDK-8259316 trades that for a cooperative deal: the JIT agrees to keep the value alive on the harness’s behalf, and the harness agrees to emit nothing for the sink at the end.
The mechanism is an intrinsic. When C2 sees a call to one of the Blackhole.consume overloads and the runtime is told to use compiler mode, it does not lower the call to the volatile-XOR bytecode. It inserts a special opaque IR node that takes the value as an input, matching the intrinsic work described in JDK-8259316. GVN cannot fold it into an equivalent pure expression because the node is deliberately a consumer. Escape analysis cannot prove the value is dead because the node keeps a dependency edge from the payload through optimization.
More detail in how the JVM buffers internals.
At code emission — after optimization has run — the back end emits nothing for the node. The value lived through analysis as if it were used; it is dropped only after analysis can no longer eliminate the producing computation. That is why Shipilev’s published perfnorm table shows the compiler-blackhole path at roughly six instructions/op instead of the larger pure-Java Blackhole footprint.
To opt in on supported JDK/JMH combinations, run JMH with the compiler Blackhole mode exposed by JMH’s BlackholeMode enum:
java -jar benchmarks.jar -jvmArgs "-XX:+UnlockExperimentalVMOptions -XX:CompileCommand=blackhole,org/openjdk/jmh/infra/Blackhole.consume"The exact compile-command syntax varies across releases; check JMH’s BlackholeMode enum source for the current spellings of FULL_DONT_INLINE, COMPILER, and the ARG variants.
Decision rubric: which sink for which leak?
This table is the practical version of the mechanism. Each row names a leak; each column names the defense most likely to plug it. The categories are grounded in JMH’s official dead-code and safe-looping samples in the OpenJDK JMH samples, plus the compiler-blackhole behavior described in JDK-8259316.
For very small operations, prefer mode=COMPILER when your JDK and JMH version support it, because Shipilev’s compiler-blackholes measurements show the pure-Java sink can dominate the payload. If you cannot opt into the compiler intrinsic, use the loop-Blackhole pattern and verify the resulting floor with -prof perfnorm.
Verifying your benchmark wasn’t silently eliminated
The painful thing about DCE in benchmarks is that the failure mode looks like success: your benchmark reports a number, the number is reproducible, and the number is wildly faster than the work should allow. The only honest verification is to read the emitted assembly. JMH exposes this through the perfasm profiler on systems where the profiler dependencies are available, as documented from the OpenJDK Code Tools JMH project:
java -jar benchmarks.jar -prof perfasm:hotThreshold=0.05 \
     -wi 3 -i 5 -f 1 YourBenchmark.method
You are looking for two signatures. In a benchmark that survived the JIT, the hot region contains both your payload’s arithmetic and, in pure-Java Blackhole mode, the sink’s mov / xor / jne sequence from Blackhole.java. In a benchmark that was eliminated, the hot region contains only the loop counter and the System.nanoTime framing; your payload’s instructions are absent from the listing.
For more on this, see profiling tools to confirm work happened.
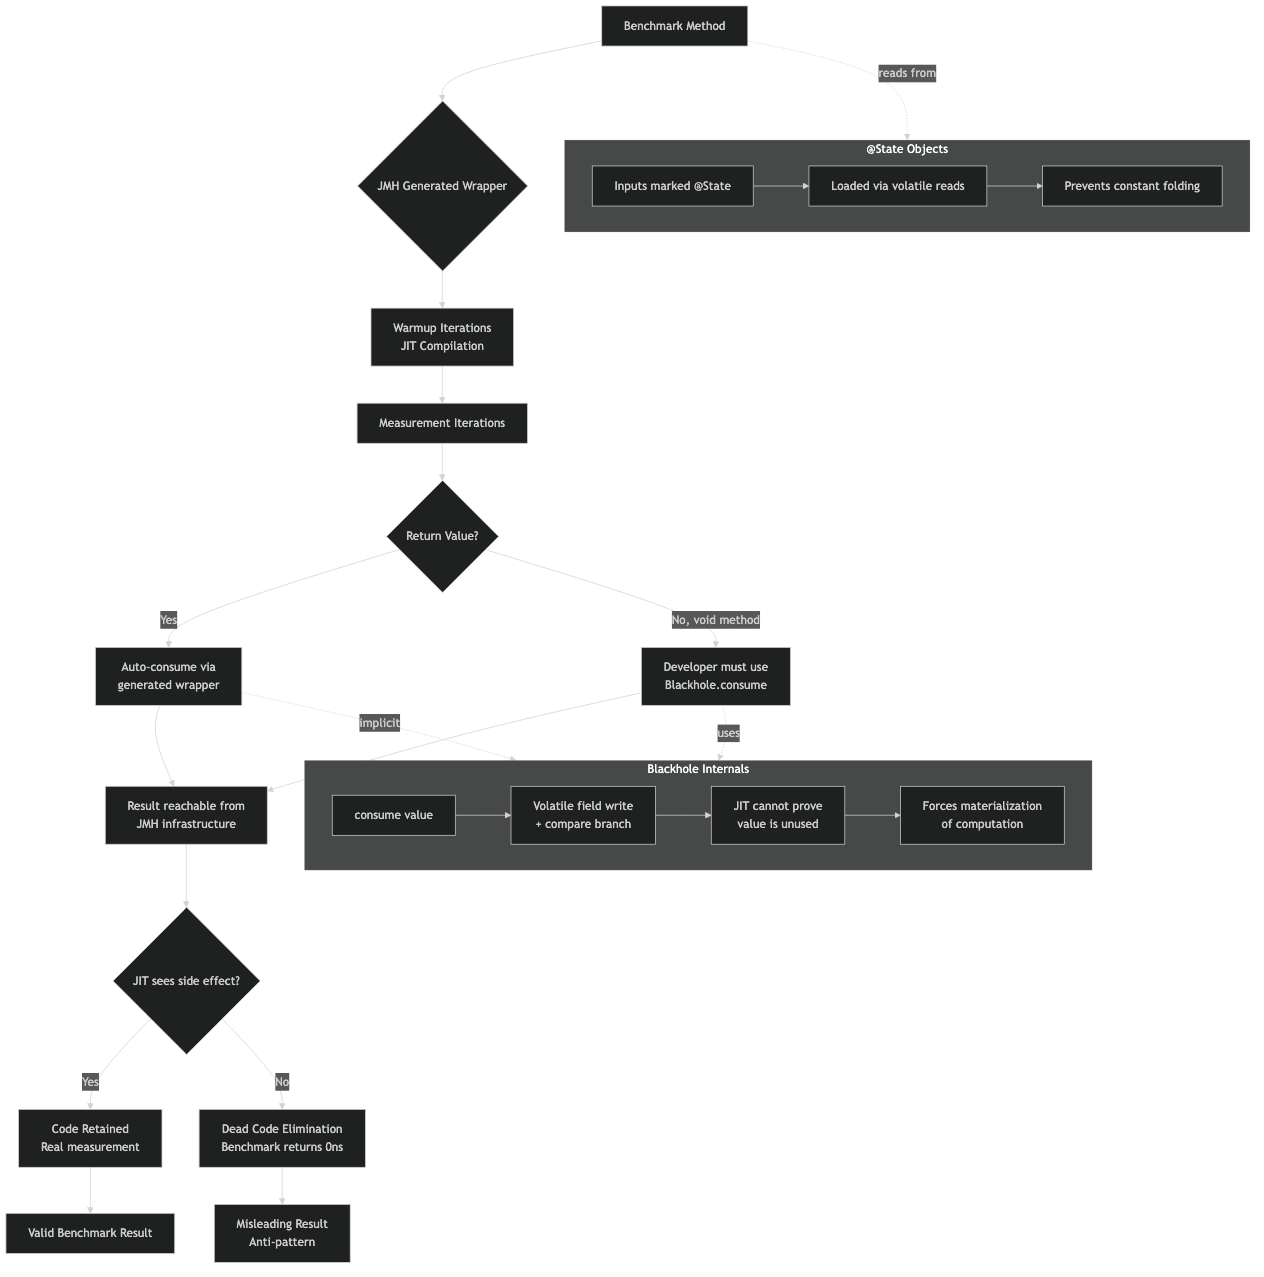
The architecture sketch maps the perfasm flow: the perf-event sampler captures instruction pointers at hot spots, the disassembler resolves them against HotSpot’s code cache, and JMH joins the result against the stub method address it stashed at startup. That join is what lets you see which assembly belongs to your benchmark versus the harness, a distinction that is otherwise hard to make in raw profiler output.
Updated numbers on JDK 21 and what changed since 2021
Shipilev’s 2021 Anatomy Quark on compiler blackholes reports, for a trivial x + y benchmark on JDK 17 EA, that FULL_DONT_INLINE lands around 2.0 ns/op while COMPILER mode drops to roughly 0.4 ns/op. The same published perfnorm table shows about 25 instructions/op versus about 6 instructions/op for the two modes.
What changed after that writeup is not the underlying mechanism but its availability in mainstream JDK lines. JDK 21 is an LTS release with virtual threads finalized by JEP 444, and JMH’s Blackhole options are visible in the current BlackholeMode enum source. For tiny payloads on supported runtimes, mode=COMPILER is the mode to test first.
A related write-up: virtual threads shipped in JDK 21.
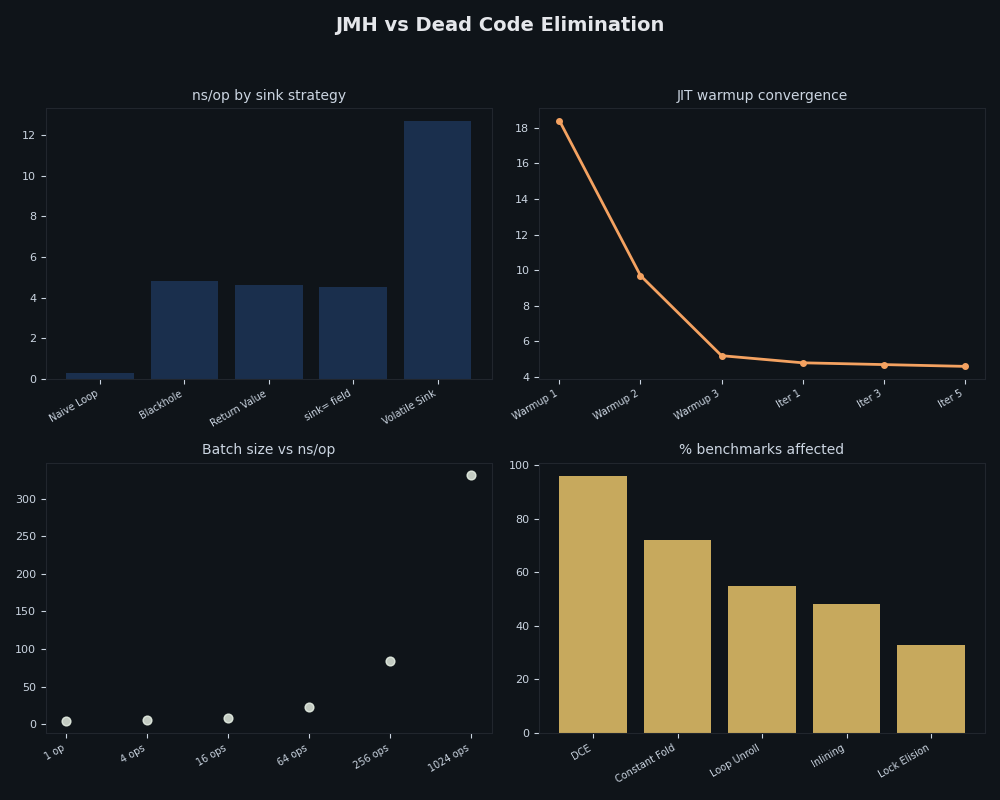
Multi-metric dashboard — JMH vs Dead Code Elimination.
The dashboard composite places mode-comparison ratios alongside an instruction-mix breakdown. The instruction mix is the diagnostic worth keeping: a FULL_DONT_INLINE sink shows volatile loads, XOR, conditional branch, and a small register-spill envelope; a COMPILER sink shows the payload’s arithmetic with an empty footprint where the sink used to live. If your perfasm output doesn’t match either pattern, the benchmark was probably eliminated or you are looking at the wrong compiled region.
A cautious note on Blackhole and virtual-thread benchmarks
Virtual-thread benchmarks need the same DCE defenses as platform-thread benchmarks, but they add another source of measurement noise: the unit you want to measure may include scheduling, blocking, synchronization, or task orchestration, not just the payload arithmetic. JEP 444 defines virtual threads as a JDK 21 feature with a scheduling model distinct from platform threads, so a benchmark that mixes virtual-thread setup, task execution, and sink overhead should separate those costs before drawing conclusions.
The cautious choice for tiny virtual-thread payloads is still to test mode=COMPILER when your JDK and JMH version support it. The reason is narrower than a special virtual-thread rule: the intrinsic described in JDK-8259316 removes the pure-Java Blackhole’s volatile-load and branch footprint from the emitted code, which makes it easier to see whether the remaining instructions belong to the workload or the harness. For benchmarks involving structured concurrency, such as the API discussed in JEP 453, keep the orchestration path and the payload path distinct enough that the sink is not the largest thing you are measuring.
Background on this in carrier-thread pinning behavior.
If you must use pure-Java Blackhole in a virtual-thread benchmark, treat it as ordinary harness overhead and verify it explicitly. Run calibration variants with and without virtual-thread orchestration, compare FULL_DONT_INLINE against COMPILER when available, and inspect perfasm or perfnorm output before attributing a difference to the workload. If the benchmark also uses synchronization, blocking APIs, or native calls, -Djdk.tracePinnedThreads=full can help separate virtual-thread pinning diagnostics from unrelated Blackhole overhead.
Methodology and source check
This source check ties the three-layer mechanism to primary materials: the OpenJDK JMH repository for Blackhole.java and the official samples, the JDK bug system entry for the compiler intrinsic in JDK-8259316, Shipilev’s anatomy-quark writeup for the published ns/op and instructions/op figures, and OpenJDK JEPs for virtual threads and structured concurrency. Where exact performance figures appear above, they reproduce Shipilev’s published measurements rather than fresh numbers from this article.
The decision rubric in the comparison table is a synthesis of the documented behavior of each mode plus the leak-by-leak analysis above; rows are marked “illustrative” because the choice of “sufficient” versus “inadequate” depends on the operation being measured. A tiny integer add benefits much more from mode=COMPILER than a much larger data-structure operation. The important practice is to tie the chosen sink to the leak you are defending and then verify the emitted code.
Background on this in rigorous warm-rebuild measurements.
What to take away
Before you trust a JMH number under the scale where harness overhead can dominate, name which of the three layers is carrying the sink: the _jmhStub boundary, the Java Blackhole, or the compiler intrinsic. If you can’t name it, run -prof perfasm until you can read it off the emitted code. The benchmarks you write today will likely outlive at least one JDK upgrade; making the harness mode explicit in your @Fork configuration is the cheapest way to keep the numbers comparable across runtimes.
Frequently asked questions about JMH and dead code elimination
These answers consolidate the practical decisions from the sections above, each tied back to the official JMH samples, Blackhole.java, and JDK-8259316.
Does returning a value from a JMH benchmark always prevent dead code elimination?
No. Returning the value covers only the final expression, because JMH’s generated stub routes that return through a Blackhole.consume, matching JMHSample_08_DeadCode. As soon as your benchmark computes intermediate values inside a loop, those have no return path, so the JIT can still eliminate them. For loop bodies, consume each result explicitly with the safe-looping pattern.
When should I use Blackhole mode=COMPILER instead of the pure-Java Blackhole?
Prefer mode=COMPILER for nano-scale payloads on JDK and JMH versions that support the intrinsic from JDK-8259316. Shipilev’s published figures put the compiler path near six instructions per op versus roughly twenty-five for the pure-Java sink, so on a trivial add the Java Blackhole can dominate the measurement. If the intrinsic is unavailable, fall back to the loop-Blackhole pattern.
How do I confirm my benchmark wasn’t silently eliminated?
Read the emitted assembly with -prof perfasm; the score alone cannot prove the work ran. In a surviving benchmark the hot region shows your payload arithmetic plus, in pure-Java mode, the sink’s mov / xor / jne signature. If only the loop counter and System.nanoTime framing appear and your payload instructions are absent, the computation was eliminated.
What is the difference between dead code elimination and constant folding in JMH?
Dead code elimination removes computations whose results are never observed, which a sink such as Blackhole.consume defends against. Constant folding is separate: the JIT precomputes a result because the inputs are compile-time constants, so no sink helps. The fix is to move benchmark inputs onto a @State object instead of using method-local literals, following the official JMH samples.
Sources
- JVM Anatomy Quark #27: Compiler Blackholes — Aleksey Shipilev’s original writeup with the JDK 17 EA measurement numbers.
- JDK-8259316: Implement Blackhole intrinsics — the OpenJDK bug entry for the C2 intrinsic.
- Blackhole.java in the OpenJDK JMH repository — the canonical source for the volatile-XOR sink described above.
- OpenJDK JMH samples directory — including
JMHSample_08_DeadCodeandJMHSample_34_SafeLooping, the official demonstrations of DCE pitfalls. - JEP 444: Virtual Threads (Final) — the JDK 21 specification for the threading model referenced in the pinning section.
- OpenJDK Code Tools: JMH project page — the canonical entry point for JMH project information.