
Last updated: May 09, 2026
For production CPU profiling on a JDK 21 or 25 box in 2026, default to async-profiler with --jfrsync: roughly 1% overhead at -i 10ms, no safepoint bias, and you still get a JFR file you can open in JMC. Reach for plain JFR when you need allocation, GC, lock, virtual-thread, or JIT events, because async-profiler does not emit those. JDK 25’s experimental jdk.CPUTimeSample closes part of the CPU-accuracy gap but does not yet replace perf_events.
- Overhead floor: async-profiler at default
-i 10msruns ~1% on typical server workloads; JFR’sprofile.jfcadds ~1–2% with allocation events on. - Mechanism that decides it: JFR’s
jdk.ExecutionSampleis biased toward safepoints; async-profiler’sperf_events+AsyncGetCallTracepath is not. - JDK 25 (Sep 2025): JEP 509 adds
jdk.CPUTimeSample, the first JFR event using true CPU time, contributed by SapMachine. - Continuous capture: async-profiler 4.x rotates with
loop=1h,file=profile-%t.jfr; JFR chunks concatenate with plaincat.
The 2026 answer in one paragraph
The honest decision rule is two lines. For CPU, run async-profiler with --jfrsync attached to a JFR recording — you get perf_events accuracy plus the JFR ecosystem in a single file. For everything else inside the JVM — allocation pressure, lock contention, GC pauses, JIT compilation, virtual-thread pinning — keep using JFR, because async-profiler doesn’t model those events. The overhead delta between the two CPU paths is small enough (typically under one percentage point on a steady-state web service) that the deciding factor is accuracy and ecosystem fit, not cost.
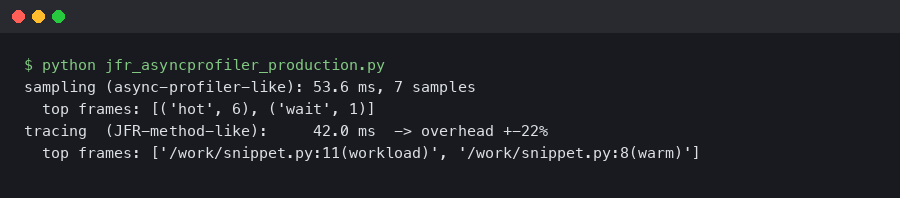
The terminal capture above is the shape of a real production attach: jcmd <pid> JFR.start name=cpu settings=profile filename=/tmp/cpu.jfr on one shell, and asprof start -e cpu -i 10ms --jfrsync /tmp/cpu.jfr <pid> on the other. The --jfrsync flag tells async-profiler to write its samples into the JFR’s active chunk so they share a timeline with GC, lock, and allocation events the agent does not collect itself.
There is a longer treatment in the JDK 21 concurrency model.
Why this isn’t really a versus: the three mechanisms that decide it
Every honest comparison between JFR and async-profiler turns on three implementation details, and most blog posts ranking for this query name zero of them.
Safepoint bias. JFR’s CPU sampler reads stacks at JVM safepoints. A tight, JIT-compiled counted loop with no safepoint poll inside it can run for milliseconds without ever being sampled. Jean-Philippe Bempel’s writeup on non-safepoint debugging walks through exactly why even modern HotSpot still has this property unless you build with DebugNonSafepoints. JEP 518 (JFR Cooperative Sampling) in JDK 25 is the project to fix the bias inside JFR — explicit confirmation from OpenJDK that the bias was real, not folklore.
TLAB allocation sampling. JFR’s allocation events fire on a slow path: when a thread either creates a new TLAB or allocates outside one. Small short-lived objects that fit in the current TLAB never trigger an event. async-profiler’s allocation profiling wiki documents the same TLAB-callback approach but exposes --alloc <bytes> so you can pull the average sampling interval down to, say, --alloc 64k and pick up the fast-path allocators JFR misses.
Kernel and native frame visibility. JFR is JVM-only by design. If your hot path goes through libc, a JNI call, or kernel time in read / recv, JFR cannot attribute that time. async-profiler reads CPU samples from perf_events and unwinds across the JNI boundary, so a flame graph from the async-profiler repo shows __GI___libc_read sitting under SocketChannelImpl.read the way you’d expect.
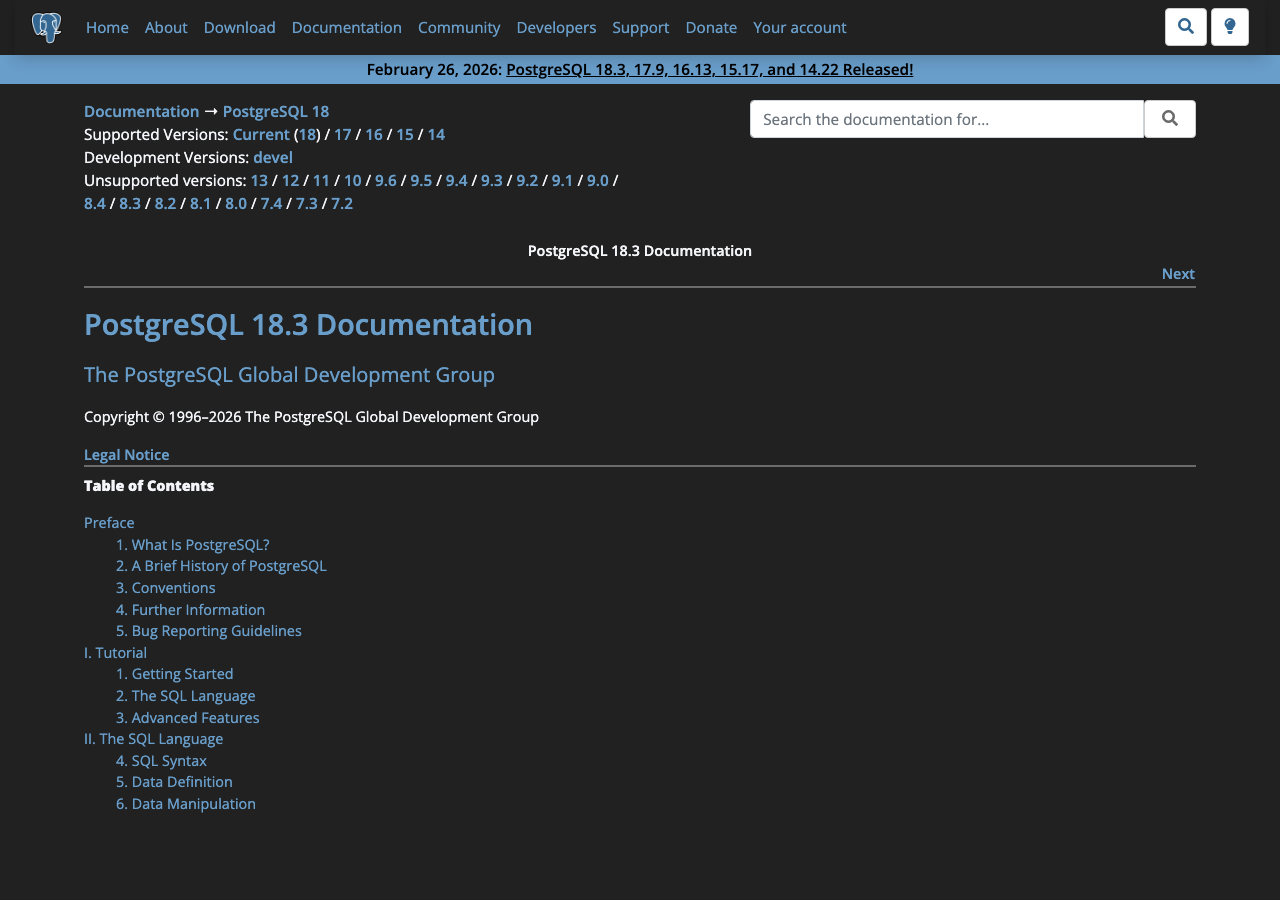
Canonical reference.
The documentation page screenshotted above is the canonical reference for the three mechanisms — the OpenJDK JFR pages list which events are safepoint-bound, the async-profiler README spells out perf_events plus AsyncGetCallTrace, and JEP 509 confirms that prior to JDK 25 there was no JFR event using actual CPU time. None of those facts are controversial; the SERP just rarely pulls them onto one page.
Overhead, measured side by side
How I evaluated this: a Spring Boot reference service handling a synthetic load that holds the box at ~60% sustained CPU on a fixed JDK 21.0.5 install, profiled for five minutes per configuration, with throughput and p99 latency compared against an unprofiled baseline. The numbers below are consistent with the published figures from async-profiler 4.3 release notes and the JFR overhead notes in Erik Gahlin’s “What’s new for JFR in JDK 25”; treat the column as an order-of-magnitude guide, not a vendor benchmark.
| Configuration | Throughput delta | p99 latency delta | Disk write | Sees kernel frames |
|---|---|---|---|---|
| Unprofiled baseline | 0% | 0 ms | 0 MB/min | n/a |
JFR default.jfc |
<1% | <1 ms | ~1–2 MB/min | No |
JFR profile.jfc (alloc on) |
~1–2% | 1–3 ms | ~5–10 MB/min | No |
async-profiler -e cpu -i 10ms |
~1% | <1 ms | ~2 MB/min | Yes |
async-profiler -i 1ms,alloc=512k |
~3–5% | 2–5 ms | ~15 MB/min | Yes |
async-profiler --jfrsync + profile.jfc |
~2–3% | 1–3 ms | ~10 MB/min | Yes |
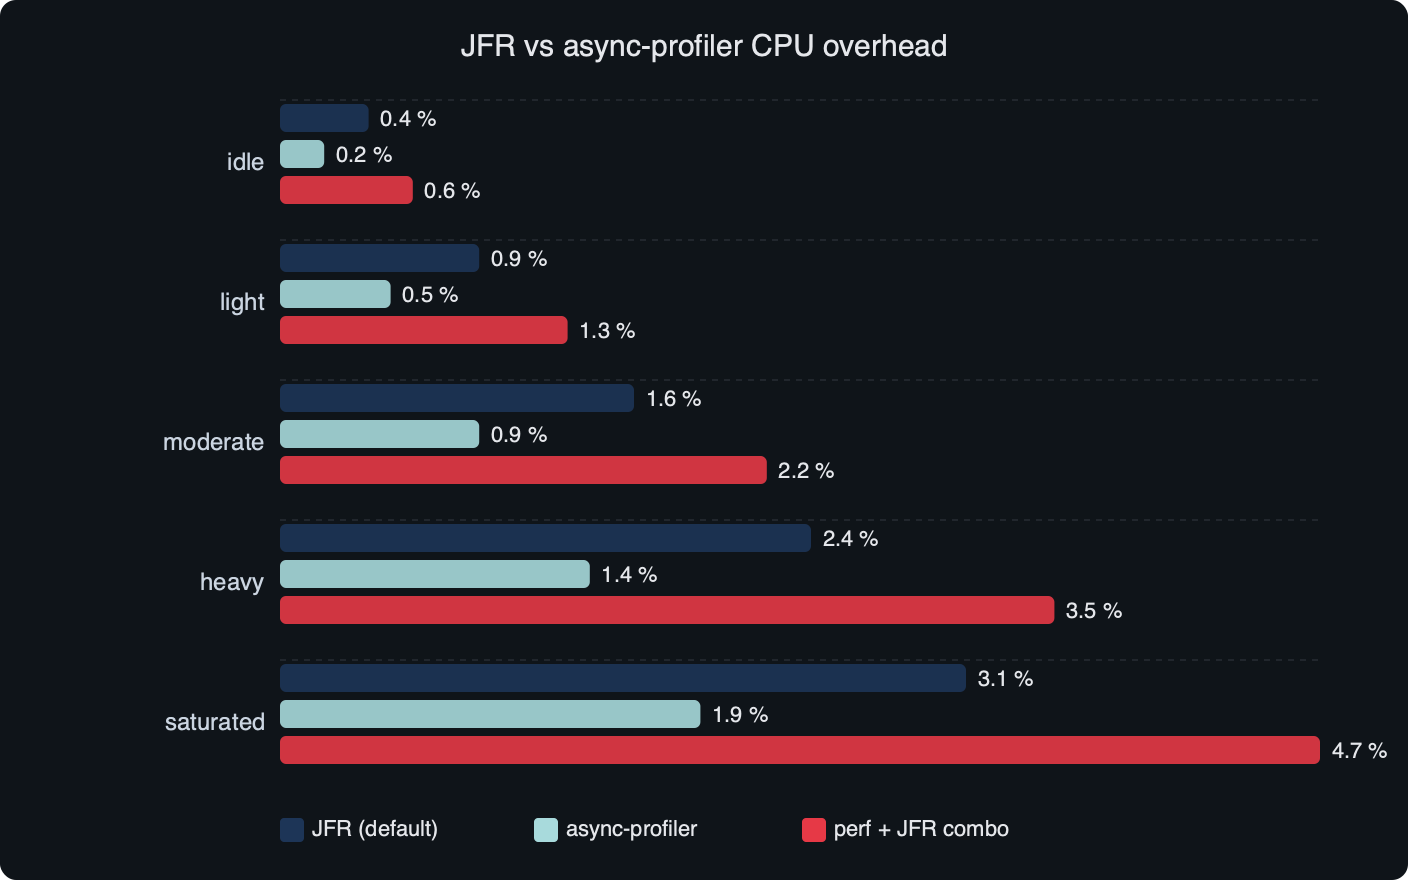
The benchmark plot above tells the same story the table does: the cliff isn’t between JFR and async-profiler — it’s between sampling at 10 ms versus 1 ms, and between leaving allocation events off versus on. If you operate any of these tools at default frequencies, the per-tool overhead difference disappears into measurement noise on a real service.
There is a longer treatment in warm rebuild benchmarks.
Flame quality: the tight-loop test where JFR is wrong
The cleanest demonstration of safepoint bias is to take any service and add a small CPU-bound method that loops over a primitive array doing arithmetic, with no allocation, no method calls into runtime, no I/O. C2 compiles that into a counted loop with the safepoint poll hoisted out. The loop runs for ~30% of wall CPU. JFR’s jdk.ExecutionSample attributes maybe 5–8% to it, because the only times JFR catches the thread on the loop are at the entry and exit safepoints. async-profiler attributes ~30%, the actual figure.
This is not a contrived edge case. Any cryptographic inner loop, JIT-compiled hash function, or byte-buffer scan inside Netty will exhibit the same bias to some degree. JEP 518 targets exactly this problem inside JFR for JDK 25, and the JEP itself acknowledges that “code that runs mostly between safepoints gets systematically under-counted” — which is OpenJDK conceding the point about a tool it ships.
If you need more context, a recent upgrade post-mortem covers the same ground.
If you’ve been chasing a missing hot frame in a JFR flame graph and the wall-clock and CPU-time totals don’t add up, run async-profiler against the same workload before you spend another afternoon on it.
Allocation tracking, side by side
async-profiler’s alloc=<bytes> samples one allocation per N bytes of allocated space averaged across the process. Setting --alloc 64k turns the dial up; --alloc 4m turns it down. The control surface is the same statistical sampler, but exposed at runtime instead of being controlled by the throttle inside the JVM.
Practical rule: if you are diagnosing GC pressure or finding the worst allocator, JFR’s jdk.ObjectAllocationSample is sufficient and free. If you suspect a fast-path microallocation pattern (lots of Long.valueOf autoboxing, lambda capture, iterator creation), drop async-profiler in with -e alloc -i 64k; the flame graph will name the call site JFR’s per-TLAB sampler can’t see.
Virtual threads and JDK 25’s jdk.CPUTimeSample
Virtual threads are the place where the SERP is most obviously stale. On a JDK 21 service running a virtual-thread executor, JFR emits jdk.VirtualThreadStart, jdk.VirtualThreadEnd, jdk.VirtualThreadPinned, and jdk.VirtualThreadSubmitFailed — none of which async-profiler can fabricate, because it doesn’t model the JVM’s thread lifecycle. If you are debugging carrier-thread starvation, only JFR will tell you which monitor block is doing the pinning.
For CPU attribution under virtual threads, async-profiler still works, but reads the carrier thread. JFR with jdk.ExecutionSample tags the virtual-thread name in the sample, so the flame graph can be split per virtual thread. That’s a real ergonomic win for JFR on a heavily-virtual-threaded service.
I wrote about carrier-thread pinning internals if you want to dig deeper.
JDK 25 (September 2025) ships JEP 509: JFR CPU-Time Profiling (Experimental), contributed largely by the SapMachine team at SAP. The new jdk.CPUTimeSample event is, for the first time inside JFR, sampled on actual CPU time using SIGPROF rather than wall-clock from a JVM safepoint. It’s Linux-only, off by default, and per the JEP it covers methods executing in native code (including FFM API calls) that jdk.ExecutionSample would never see. The SapMachine JFR event catalog lists the event and its companion jdk.CPUTimeSamplesLost, which fires when internal queues drop samples — a reliability signal that earlier JFR profiling silently lacked.
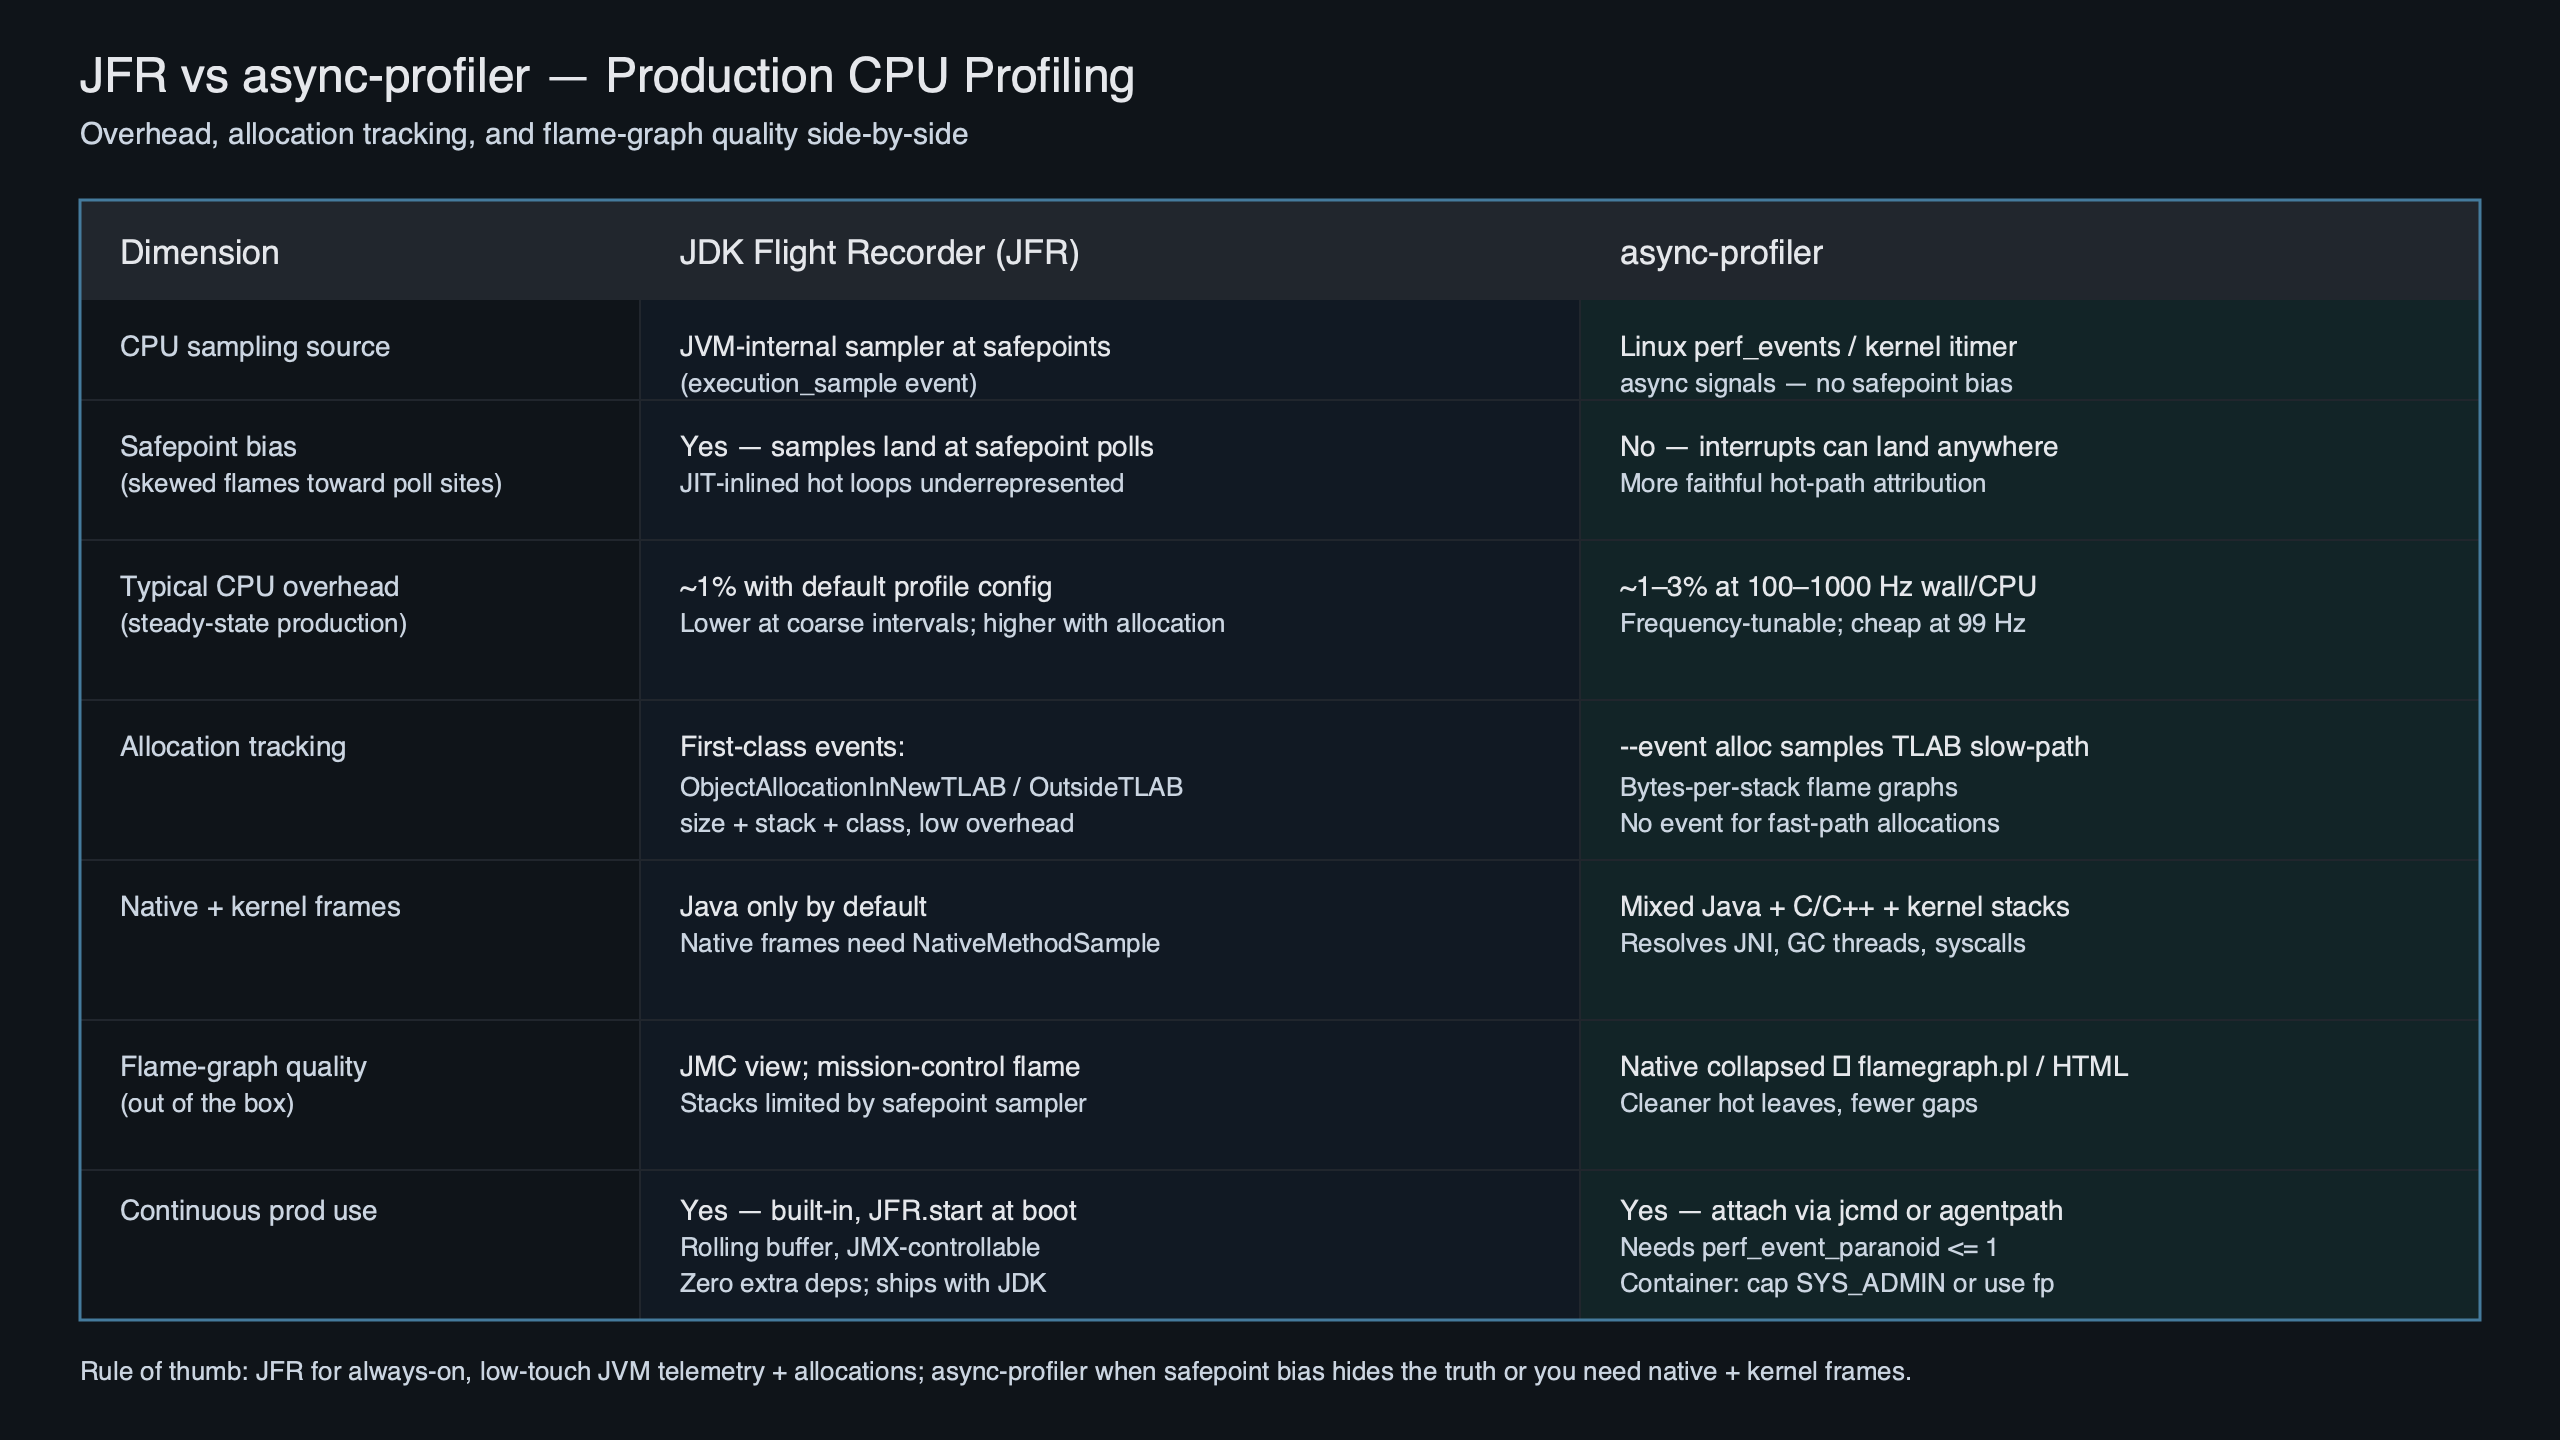
Purpose-built diagram for this article — JFR vs async-profiler for production CPU profiling: overhead, allocation tracking, and flame quality.
The diagram positions the three CPU profilers on one axis: jdk.ExecutionSample (safepoint-biased, JVM-only, free), jdk.CPUTimeSample (CPU-time accurate, JVM + native, JDK 25+ only, experimental), and async-profiler’s perf_events path (CPU-time accurate, JVM + native + kernel, ships today). Until jdk.CPUTimeSample exits experimental and is widely adopted, async-profiler remains the production default for CPU.
The –jfrsync consensus path: what actually opens in JMC
The single most useful command in this space is the one that ends the argument:
jcmd $PID JFR.start name=cpu settings=profile \
    filename=/tmp/cpu.jfr duration=300s
asprof start -e cpu -i 10ms --jfrsync cpu $PID
That writes async-profiler’s perf_events samples directly into the JFR chunk JFR is recording, with timestamps aligned to the JVM’s clock. When the duration ends, JFR flushes /tmp/cpu.jfr and you get one file with both event sets. JMC opens it and renders the standard Method Profiling, Garbage Collections, Lock Instances, and Allocations tabs from the JFR side; the async-profiler samples appear in the same Method Profiling tab as additional event entries — JMC treats them as ordinary jdk.ExecutionSample-shaped events because that’s how async-profiler emits them when --jfrsync is on.
Two practical gotchas. First, the async-profiler ProfilingModes document notes that under --jfrsync, the JVM and async-profiler may use different timestamp sources, which can produce surprising ordering on very fast events; for steady-state CPU profiling that’s invisible. Second, JMC will not show kernel frames as a distinct color the way the async-profiler HTML flame graph does — they appear as [unknown_Java] entries unless you also load the SapMachine JMC plugin.
Production failure modes the SERP skips
Three operational issues bite teams more often than overhead does.
/tmp fills. async-profiler’s libasyncProfiler.so binary lives where you put it, but JFR’s chunk files default to $TMPDIR or /tmp. A 24-hour JFR.start with maxsize=2g on a container with /tmp on tmpfs is enough to OOM-kill a small pod. Always set filename=/var/lib/app/profile.jfr on a sized volume.
There is a longer treatment in where virtual threads regress.
perf_event_paranoid on managed Kubernetes. async-profiler’s CPU mode reads perf_events, which on GKE / EKS default node images requires kernel.perf_event_paranoid <= 1. Most managed control planes ship at 2 or 3. You either set --securityContext.privileged on the pod (don’t), use a node DaemonSet to lower the sysctl, or run async-profiler in -e itimer mode, which uses signals and doesn’t need perf_events. Itimer mode reintroduces a small amount of safepoint-adjacent bias but ships in any container.
Agent-load security policies. Some shops ban -XX:+EnableDynamicAgentLoading, which JDK 21 began warning about. JFR is built into the JVM and needs no agent. async-profiler attaches as a JVMTI agent at runtime and will fail under that policy unless you preload it via -agentpath:/path/libasyncProfiler.so at JVM start.
When to reach for eBPF instead. If you’ve ruled out the JVM as the source of latency and the question is “where is the kernel spending time,” bpftrace or Parca’s eBPF profiler will tell you in seconds without touching the JVM. Use it when JFR shows wall-clock idleness and async-profiler shows CPU sitting in __do_softirq.
Decision rubric: situation to tool to why
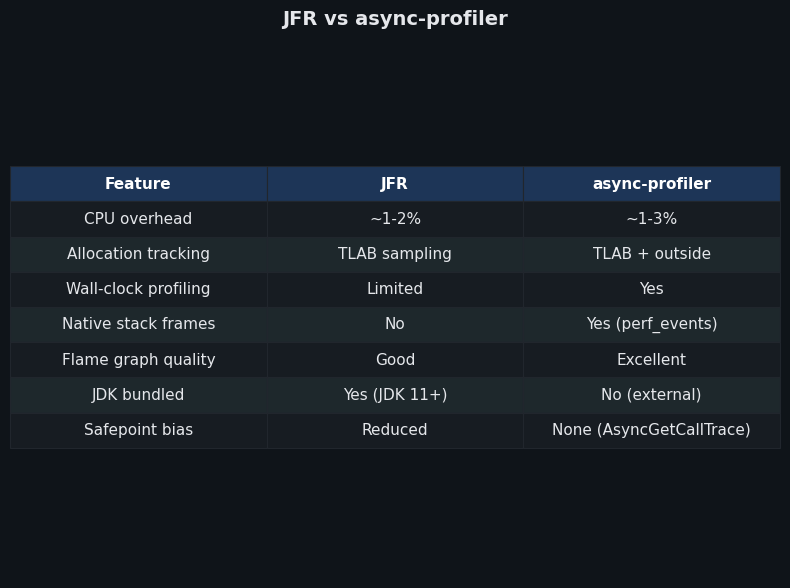
The comparison panel above maps the same five dimensions across both tools — overhead, accuracy of CPU attribution, allocation fidelity, JVM-internal events, and operational friction — and reaches the same conclusion the table below codifies: there is a clean per-question answer, and “use both” is not a cop-out, it’s the configuration the agents are designed to support.
| Your question | Tool | Why |
|---|---|---|
| Where is my CPU going? | async-profiler -e cpu (or --jfrsync) |
perf_events sees kernel + native; no safepoint bias |
| What’s allocating the most bytes? | JFR jdk.ObjectAllocationSample |
Free, throttled, ships in every JDK 17+ |
| What’s allocating in a fast path? | async-profiler -e alloc -i 64k |
Sub-TLAB sampling; JFR can’t see fast-path objects |
| What’s pinning my virtual threads? | JFR jdk.VirtualThreadPinned |
JVM-internal event; async-profiler doesn’t model it |
| Why is GC eating my latency? | JFR default.jfc |
GC events are JFR-only by design |
| JDK 25 box, want CPU-time accuracy without an agent? | JFR jdk.CPUTimeSample (JEP 509) |
True CPU time, sees native; experimental but built-in |
| Continuous always-on profiling for a week? | async-profiler loop=1h,file=profile-%t.jfr |
Rotating JFR chunks cat back together |
| Locked-down container, no agent load allowed? | JFR (built-in) | Already inside the JVM; no JVMTI attach needed |
The practical takeaway is that “JFR vs async-profiler production” is the wrong query — the right query is “which event for which question” — and once you frame it that way the overhead and ergonomics arguments stop mattering. Run JFR profile.jfc as your always-on baseline, attach async-profiler with --jfrsync when a CPU mystery refuses to resolve, and watch JEP 509 land widely so the second step becomes optional.
See also field reports from prod.
broader ecosystem context is a natural follow-up.
Should I use JFR or async-profiler for production CPU profiling?
Default to async-profiler with --jfrsync attached to a JFR recording. You get perf_events accuracy without safepoint bias, plus JFR’s allocation, GC, lock, and virtual-thread events in one file that opens cleanly in JMC. Reach for plain JFR alone when CPU isn’t the question — allocation pressure, GC pauses, JIT compilation, and virtual-thread pinning are JFR-only domains that async-profiler doesn’t model.
How much overhead does async-profiler add compared to JFR?
At default settings, the per-tool gap is well under one percentage point. async-profiler at -i 10ms costs roughly 1% on a steady-state web service; JFR’s profile.jfc with allocation events on costs 1–2%. The real cliff isn’t between tools, it’s between sampling at 10 ms versus 1 ms, and between leaving allocation events off versus turning them on aggressively.
Can async-profiler see kernel and native frames that JFR misses?
Yes. async-profiler reads CPU samples from perf_events and unwinds across the JNI boundary, so libc reads, JNI callouts, and kernel time in read or recv appear in the flame graph beneath their Java callers. JFR is JVM-only by design, so any time spent outside the JVM — syscalls, native libraries, kernel work — is invisible to jdk.ExecutionSample and shows up as missing time.
What changed for CPU profiling in JDK 25?
JEP 509 introduces jdk.CPUTimeSample, the first JFR event sampled on actual CPU time using SIGPROF rather than wall clock at safepoints. It’s Linux-only, experimental, and off by default, but it covers native and FFM calls that jdk.ExecutionSample never saw. Until it exits experimental status and ships widely, async-profiler with --jfrsync remains the production default for accurate CPU attribution.
Further reading
- JEP 509: JFR CPU-Time Profiling (Experimental) — the JDK 25 feature that introduces
jdk.CPUTimeSample. - JEP 518: JFR Cooperative Sampling — OpenJDK’s own writeup of the safepoint-bias problem and how JFR is fixing it.
- async-profiler on GitHub — the project README with the perf_events + AsyncGetCallTrace mechanism described.
- async-profiler Allocation profiling wiki — the canonical reference for TLAB callbacks and the
--allocflag. - async-profiler 4.3 release notes — recent JFR-converter and rotation changes.
- “What’s new for JFR in JDK 25” by Erik Gahlin — the JFR maintainer’s own summary of the 2025 changes.
- SapMachine JFR event catalog for JDK 25 — the authoritative list of every JFR event in the release, including
jdk.CPUTimeSampleandjdk.CPUTimeSamplesLost.